Dashboard
An overview of traffic activity
The Dashboard screen displays all incoming traffic and the actions executed in response to the different traffic events.
The Dashboard screen automatically presents data for the last 5 minutes. To view other activity, specify the desired timeframe using the filter in the top right corner of the screen, as explained below in Filtering and Time Interval Selection. Use the archives to "go back in time" and see previous activity.
The user interface has three main sections:
Filtering and Time Interval Selection
Query Box
Allows you to easily filter the display to show exactly what you want. The structure of a filter is operator:value.
For example, to show all traffic from France that was blocked:
country:France, is:blocked
For a full explanation of Reblaze's Query box, including operators and syntax, go here.
Time Interval Selection
Enables the user to select a pre-defined time frame, or a custom time period. See the video below:
Traffic Graphs
Passed vs. Blocked
This section shows the traffic that was processed by Reblaze: requests which passed through to the upstream servers, and requests that were blocked. Hits are distributed by time and sorted into three different categories: Humans, Challenges, and Blocked. As you can see in the example below, the data is shown in different colors to easily distinguish among the categories.

Response Status
Counts the number of status codes in a certain time period.
HTTP Status response codes are divided into five categories:
1xx - Informational Response
2xx - Request Successful
3xx - Request For Redirection
4xx - Client Error
5xx - Server Error
For a detailed list of response codes, go here.
As in the Passed vs. Blocked display, the data is shown in different colors.

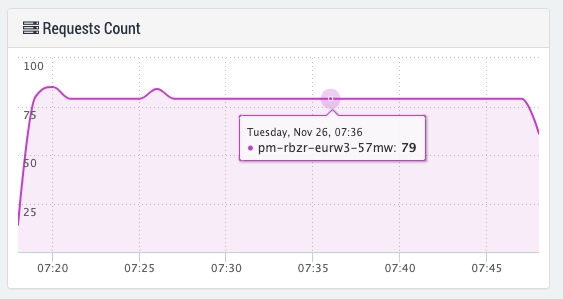
Requests Count
The number of network requests during a certain period of time.
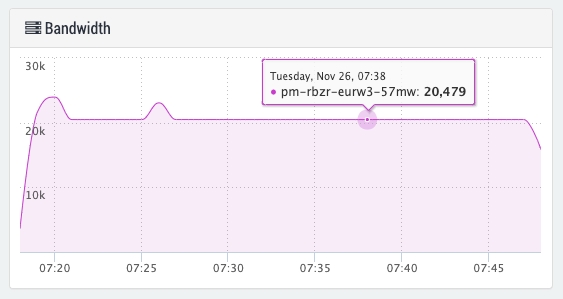
Bandwidth
The downstream bandwidth limitation per response. Left-axis units are "k" for kilobytes, and "M" for megabytes.
Latency
This displays the time (in milliseconds) consumed by Reblaze's processing.

Zooming in
You can zoom in upon the various graphs, in order to examine a smaller window of time. The video below demonstrates this process.
"Top" Section
This section displays traffic statistics according to a variety of "top" metrics: the Top Applications, Top Countries, Top Signatures, etc.
In many of these displays, entries contain links. Clicking on them will open the traffic log, filtered to show the item you selected. For example, in the "Top Countries" view, clicking on a country name will open the traffic log to display the most recent requests originating from that country.
Section Characteristics
Name
Description
Hits
Total amount of requests
Passed
Requests that reached the upstream server
Blocked
Requests that were blocked by one of Reblaze’s correlation engines.
Humans
Requests that passed Reblaze's human vs. bot challenge process.
Bots
Requests with originators that were not (yet) verified as humans. For a full explanation, see Counting Bots.
Challenges
Requests that were served with bot detection challenges.
Latency
How much time it takes for a packet of data to get from one designated point to another. Displayed in milliseconds.
Dn
Amount of traffic in MB that originated from the upstream server towards the clients.
Up
Amount of traffic in MB that originated from the client towards the upstream server.
Applications
Shows all protected sites for the current Reblaze deployment. Applications marked in red have a blockage rate above 30%. The blockage rate is the ratio of requests blocked by the system to the number of total network requests.
Note that in this section, "Passed" and "Latency" entries aren't shown, and "Cloud", "Anon" and "Blockage" are added. Their meanings are:
Name
Description
Cloud
Cloud Providers (GCP, AWS, etc.)
Anon
Anonymous Proxy Browsers
Blockage
Blockage rate

Countries
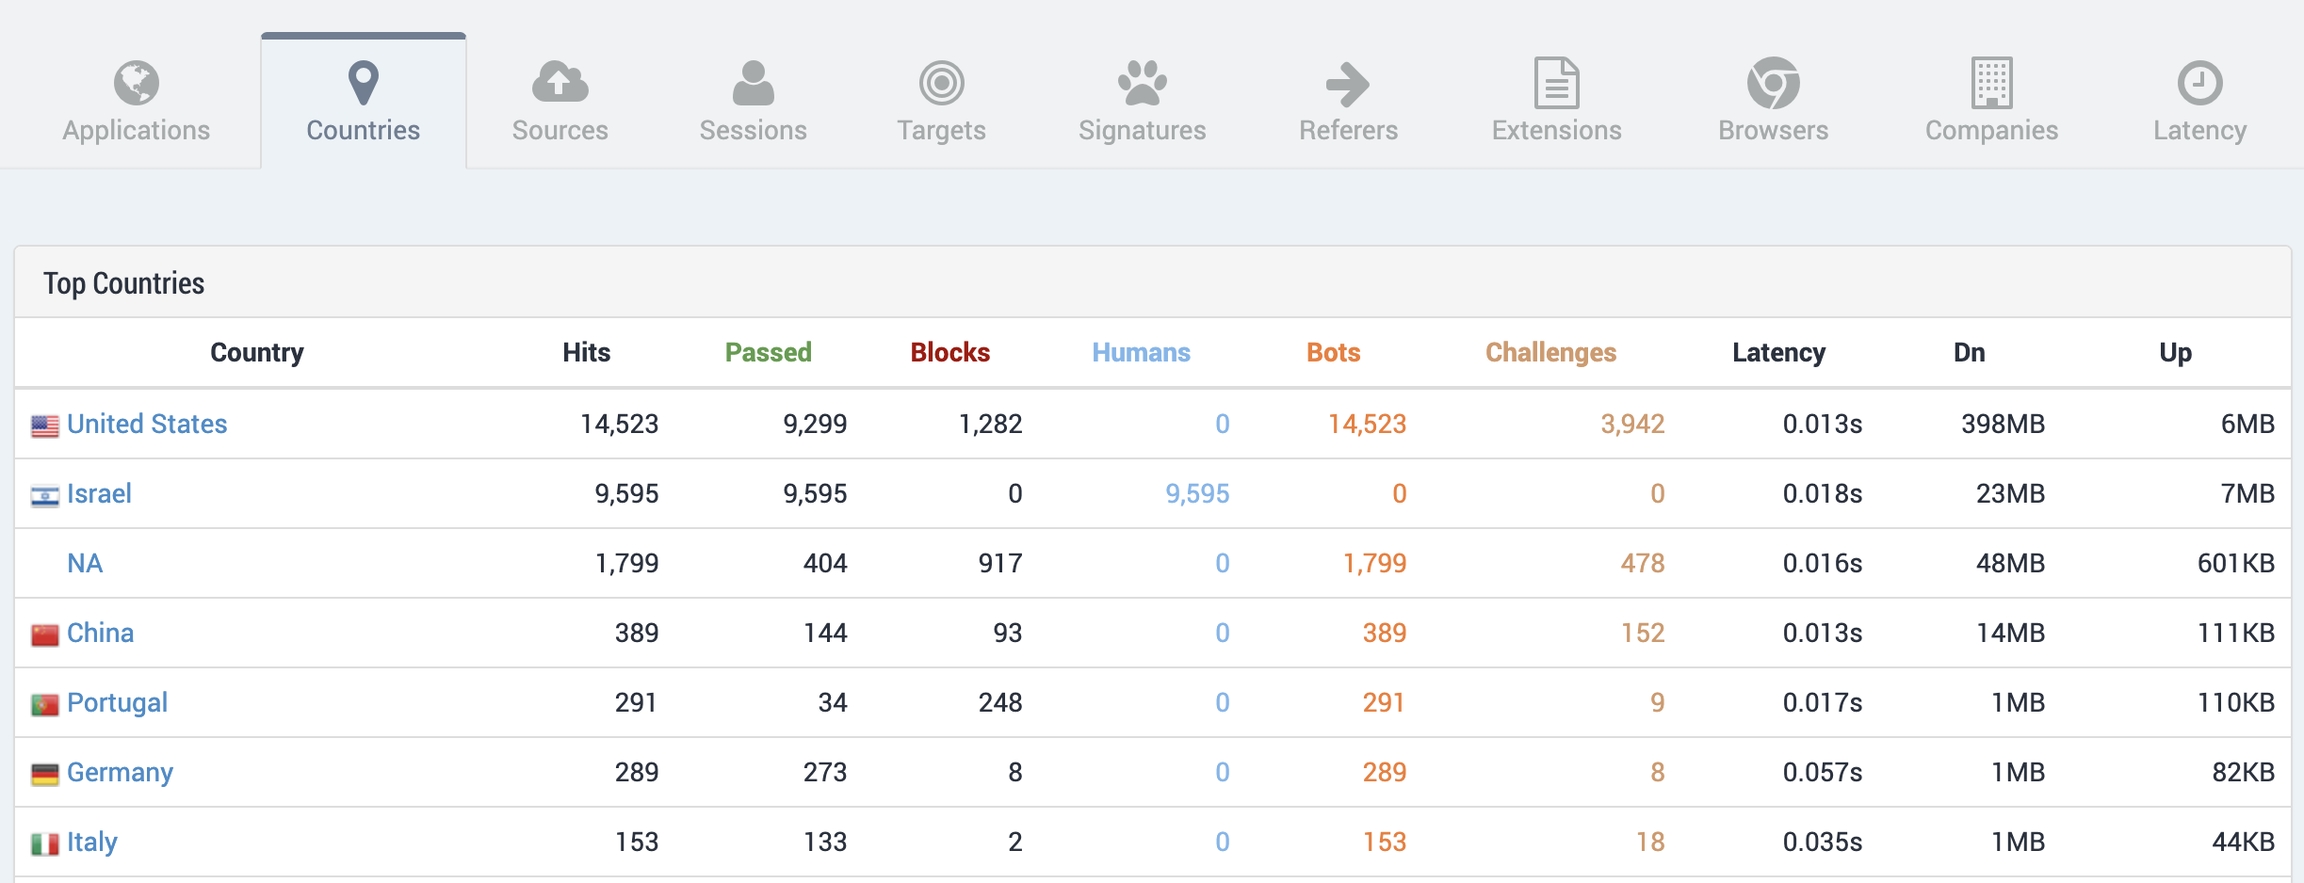
Shows your traffic sorted by country. Each country's flag is shown by its name.
Sources
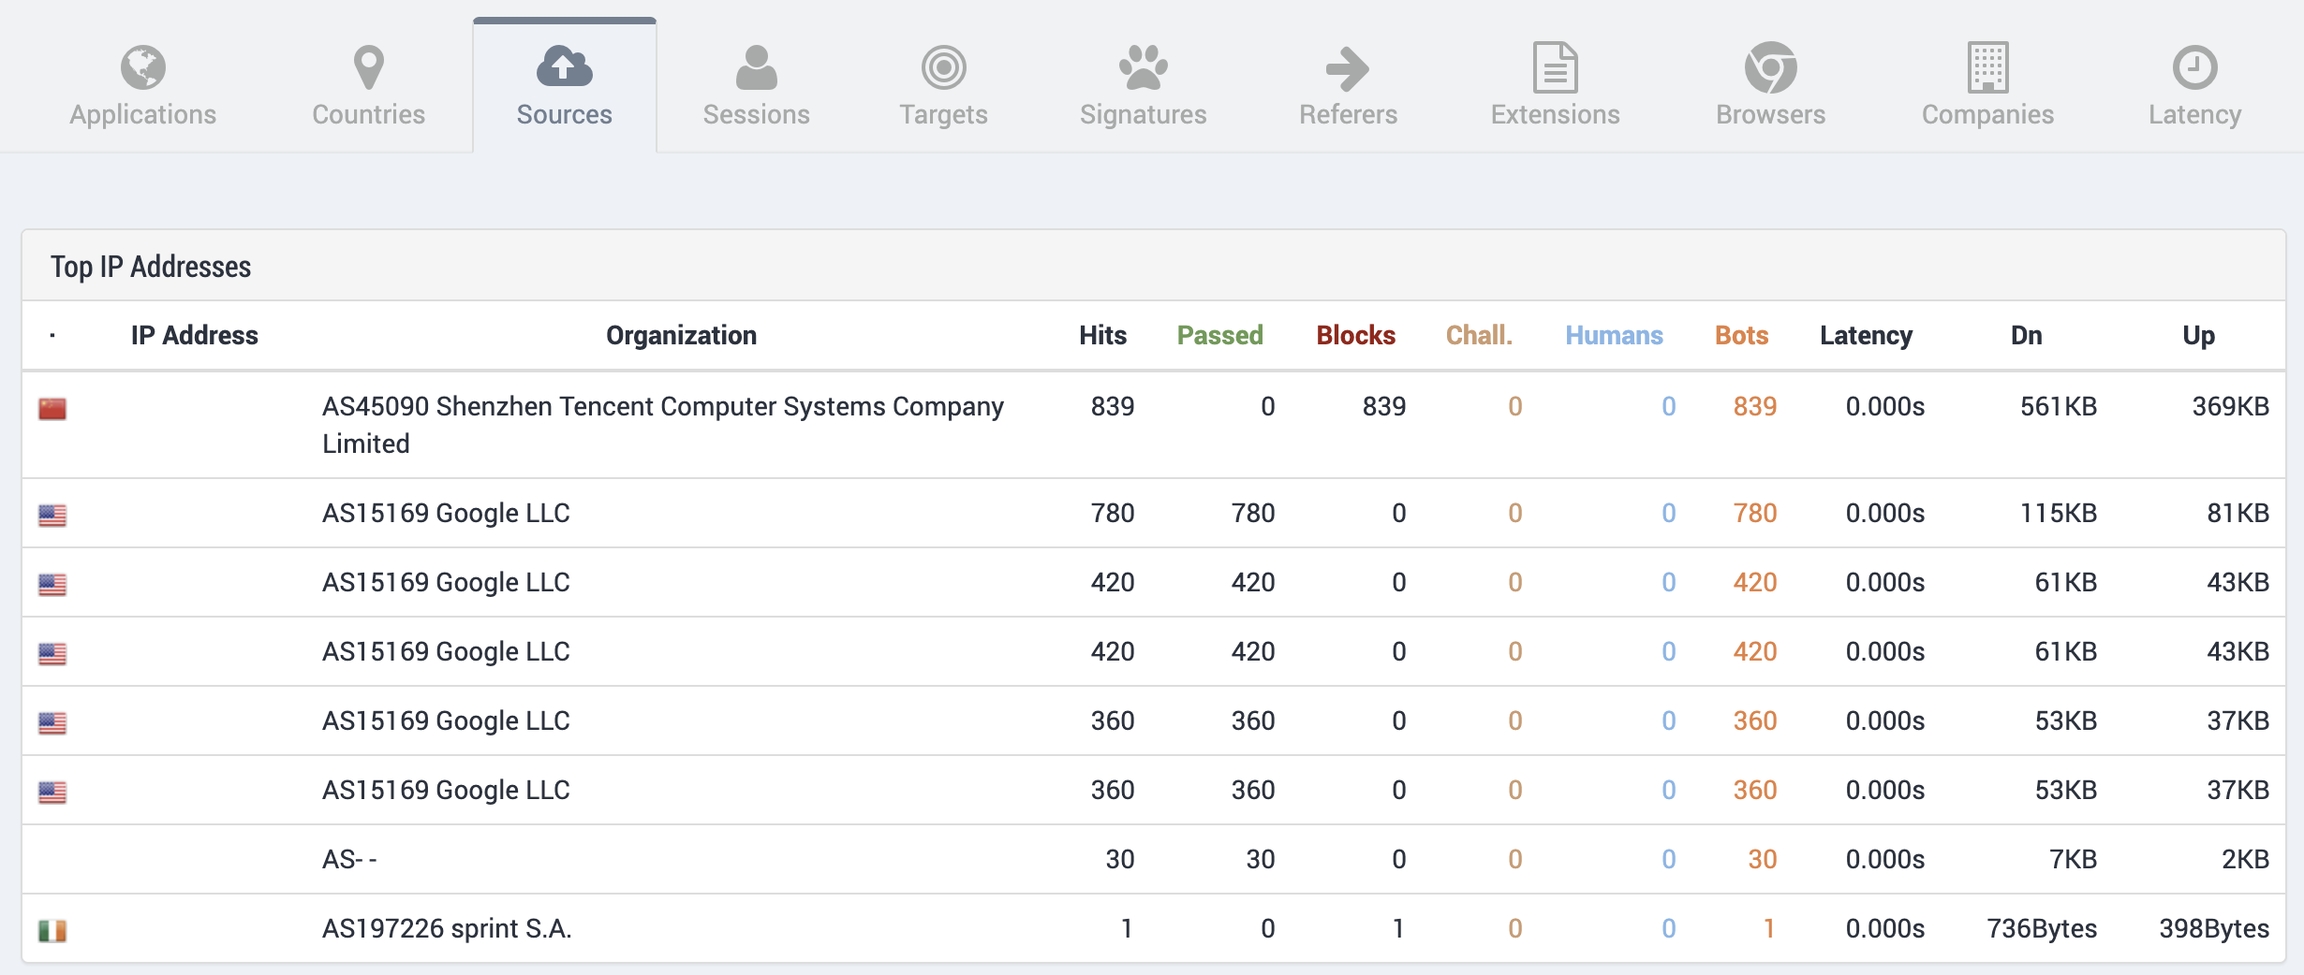
Shows traffic data according to IP address. The ASN (autonomous system number) for each IP is also shown.
Sessions
Shows the nature of user sessions. Sessions that pass Reblaze's bot mitigation challenge are identified as originating from humans, and are listed here according to the user's RBZ (Reblaze) cookie ID. In the screenshot below, note that the first line shows "-" for the ID. These are sessions that did not pass the challenge.

Targets
Shows the URLs in your site(s) that were accessed the most frequently.

Signatures
Shows the reasons that traffic was blocked. Unlike other displays, this section does not include hits, passed, blocked, etc.—the counter only shows the number of blocks per signature. Here you can see which types of attacks are most common in your environment. In the example screenshot below, the first entry is "-": this shows requests that were blocked, but not by Reblaze (i.e., they were blocked "by origin"—by the upstream server).
In the example screenshot below, the third and fourth entries include a "ref" value. These are Reblaze reference IDs, explained here.

Referers
Shows the referers that were extracted from the request headers.

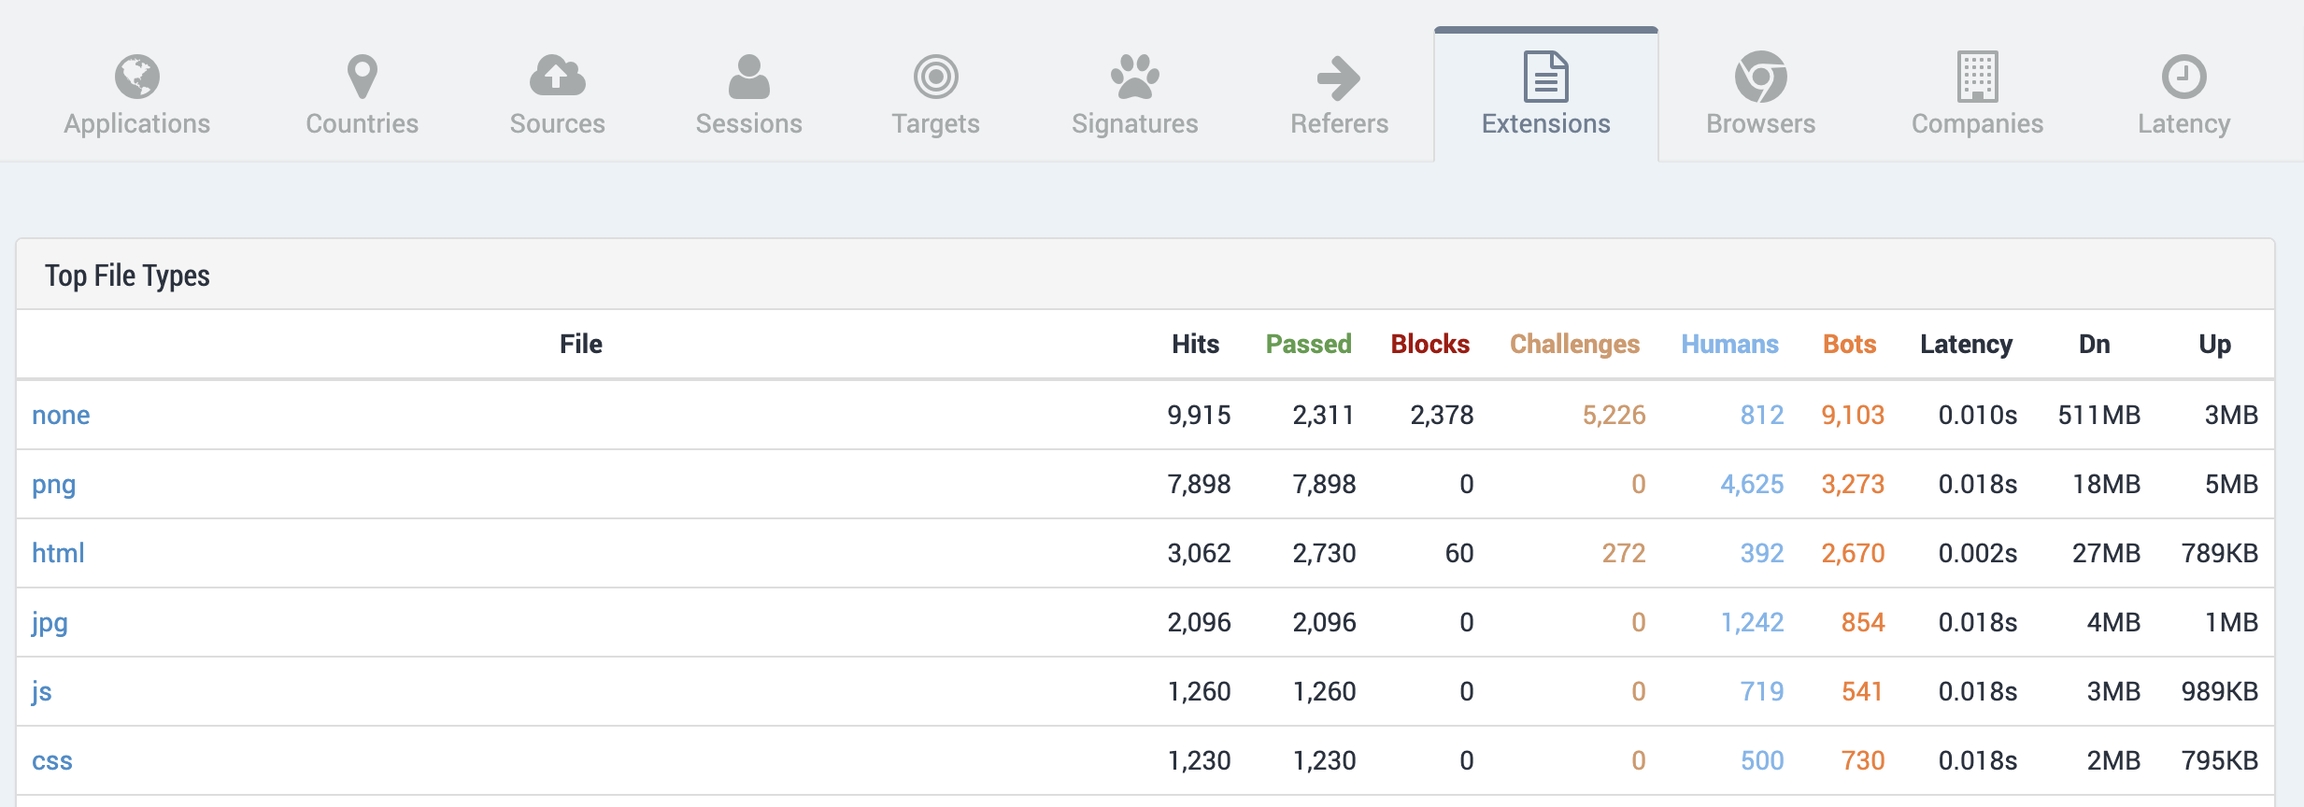
Extensions
Allows you to view the various file types that are being used by the application. ("None" shows the network requests that weren't counted as file extensions.)
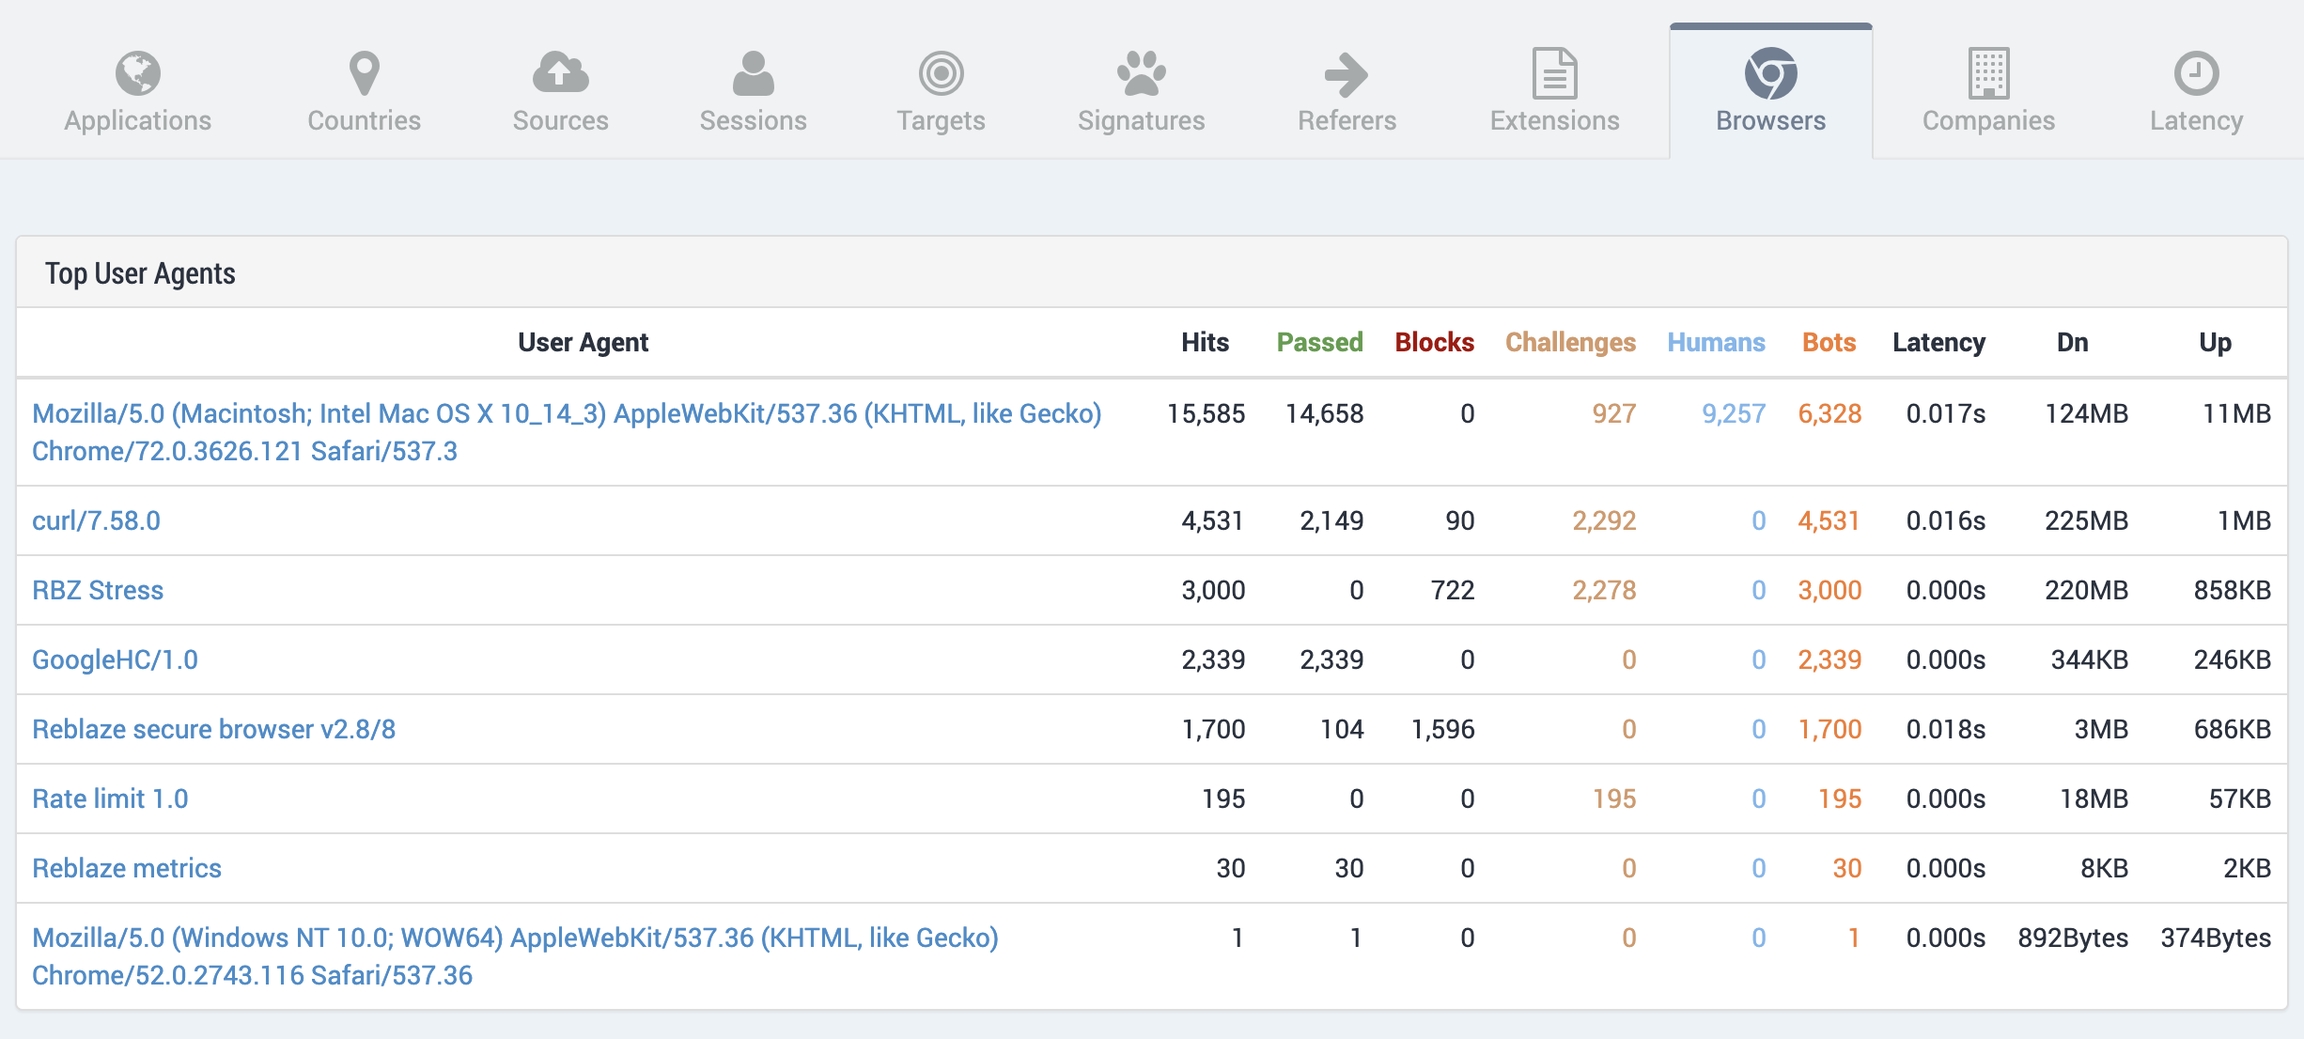
Browsers
Shows all the user agents that initiated requests for the application(s).
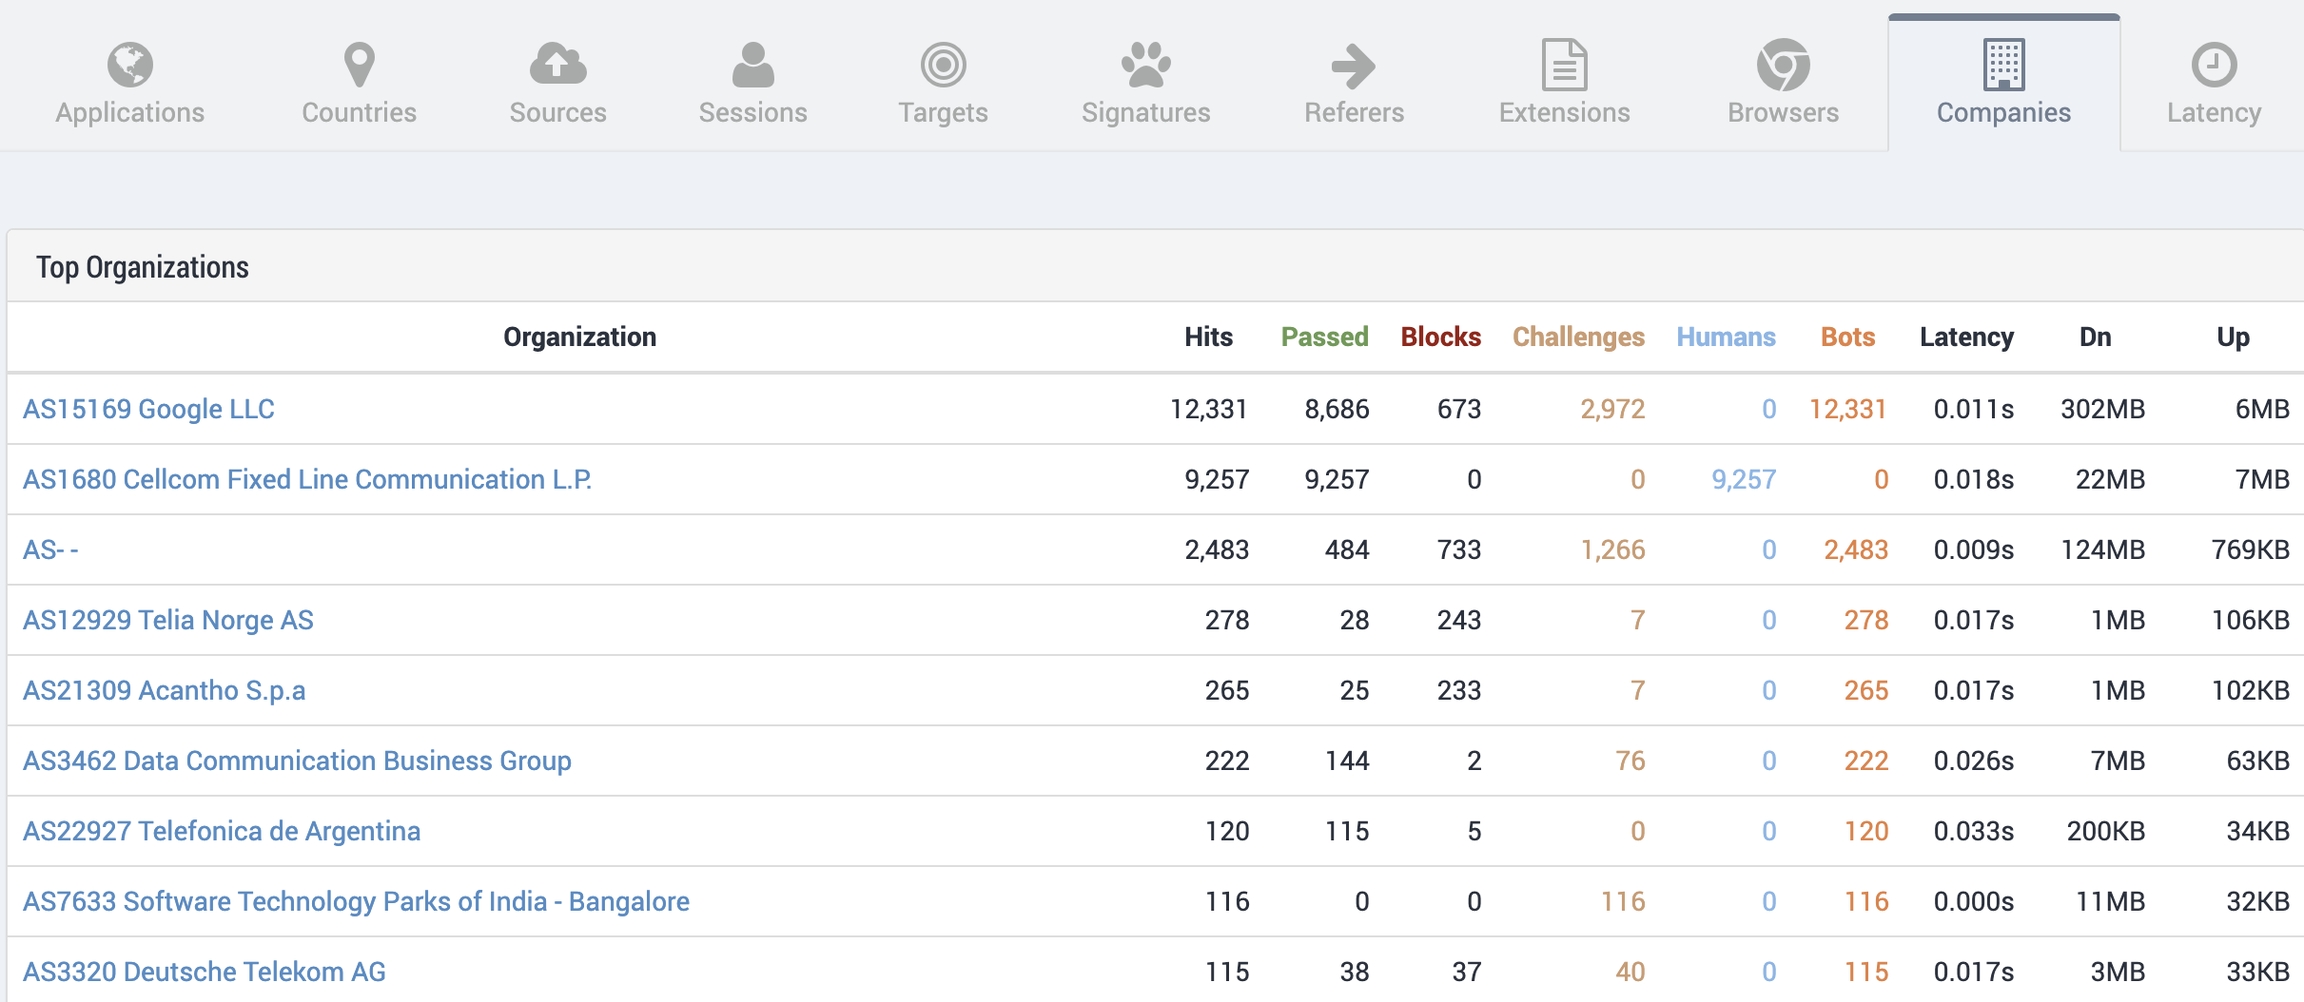
Companies
Shows all of the ASNs (Autonomous System Numbers) from which requests were sent. The ASN can identify individual entities, or larger networks: for example, a telecom provider or a cloud provider.
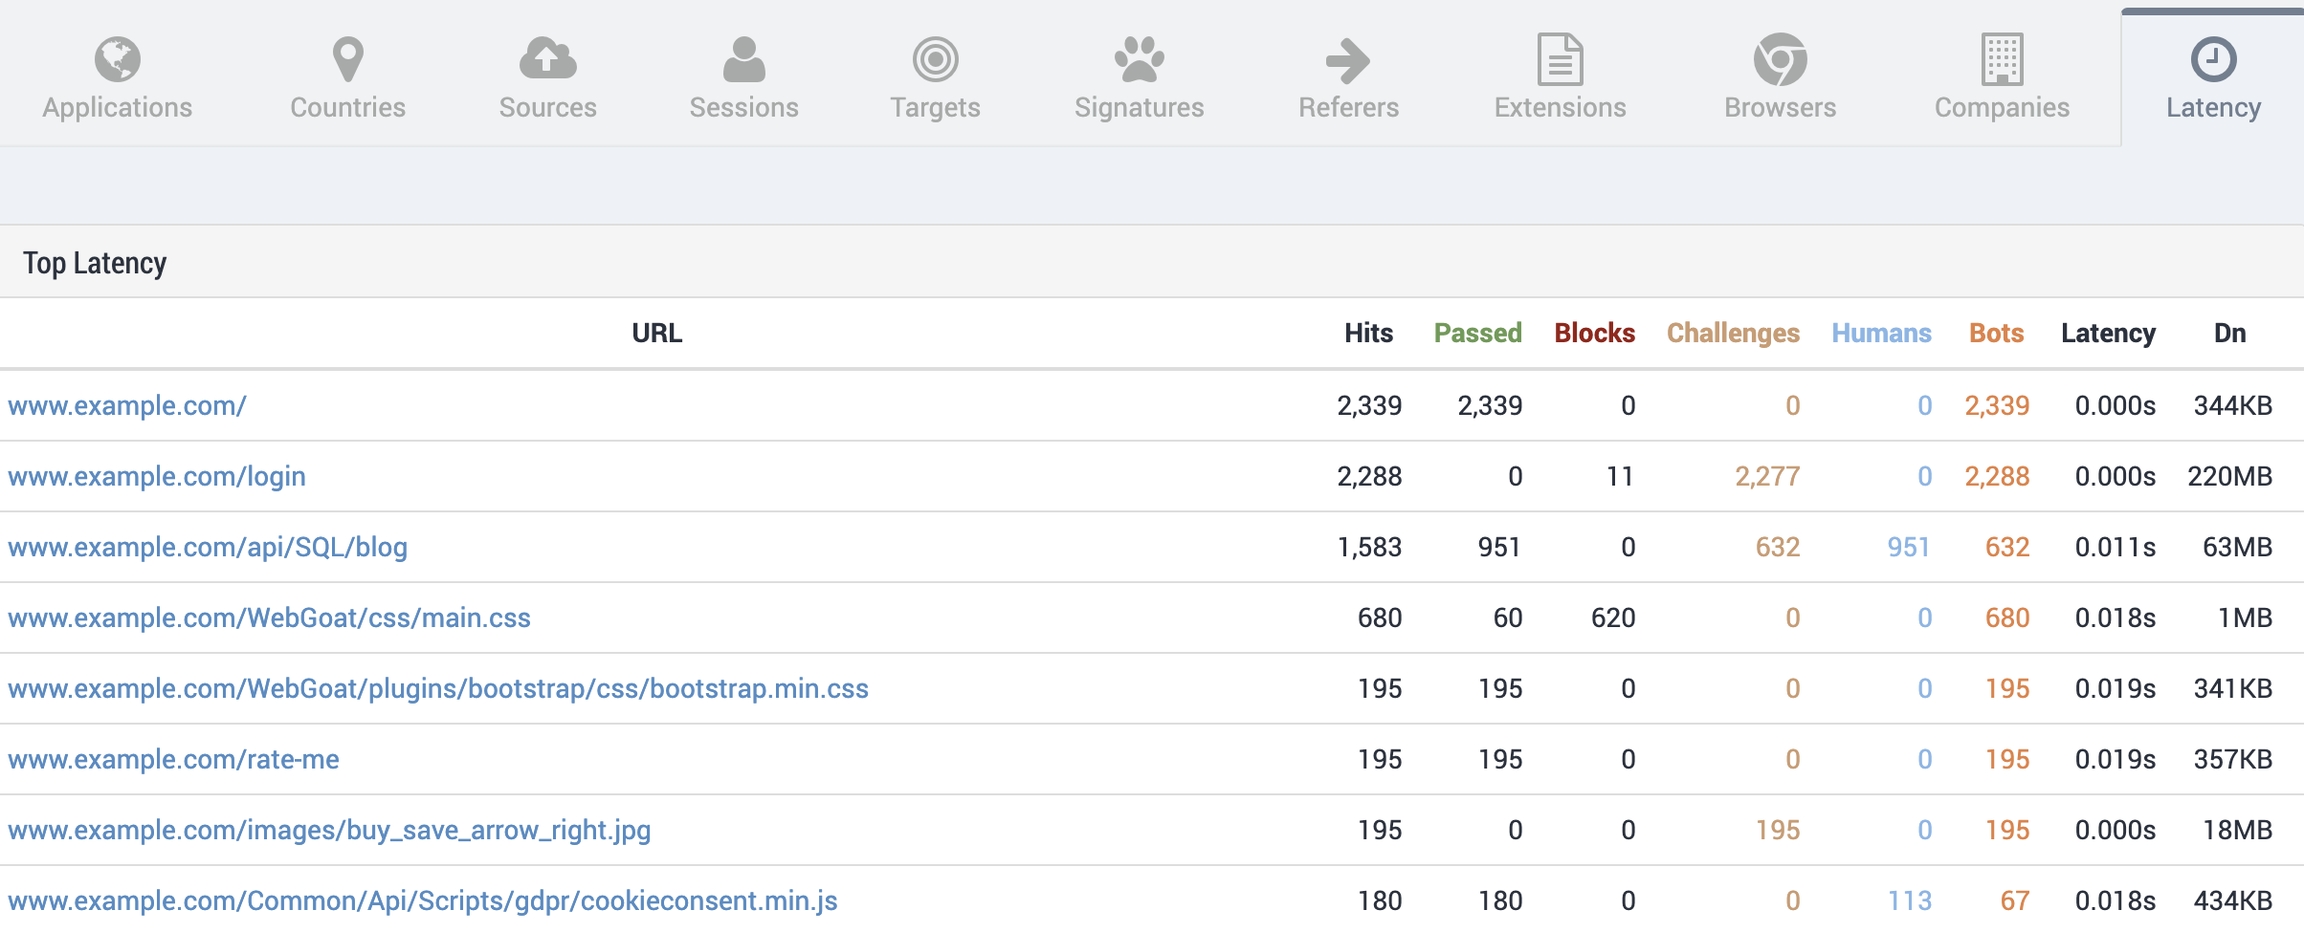
Latency
Shows a list of all applications, with the corresponding latency for each.
Was this helpful?